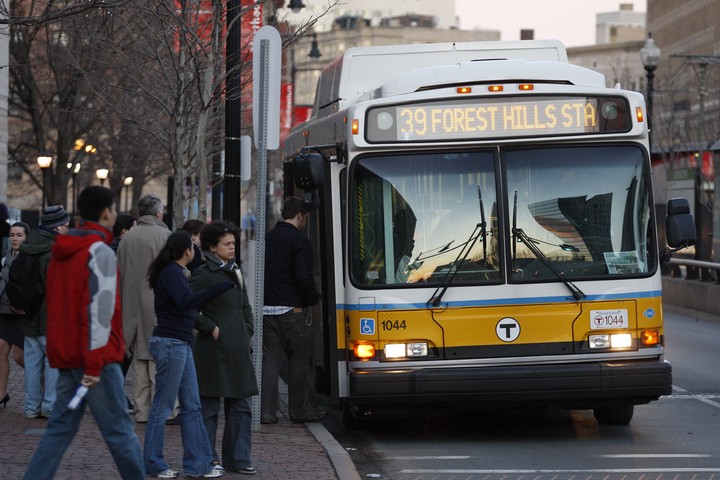
 MBTA Bus 39
Introduction
Accessibility to transportation has long been considered to have an effect on quality of life indicators such as income, education and health levels. (Syed, Gerber and Sharp 2014) Today around the world, there are still many communities without access to all weather roads, thus limiting their residents’ ability to integrate more into the wider world. In urban areas this often translates into residents of neighborhoods with underrepresented populations not having equitable access to the city’s public transit system, thus making it difficult for them to have access to employment and schooling. (Kumar and Karvajal 2017)
In a transit rich area with a higher transit dependence commute is one of the key criteria for housing and employment choices. (Schaper 2018) This is even more evident today due to the post-20th century phenomenon of migration from suburbs towards denser urban areas which North American cities have been particularly prone to. The 20th century was dominated by wealthy suburbs and relatively poorer inner cores – none more so evident in North America. This trend has caused demand to surge, but housing stocks haven’t been able to keep pace with this demand.
Hypothesis
As such it was deemed necessary to see if there is any connection between this increased demand for housing and jobs and the availability of transit options. A better way to probably frame this would be:
Does the distance to or availability of public transport have any effect on investment and property prices in a city?
SomerVision
To be able to answer that, we can look at the city in consideration: Somerville, Massachusetts. Somerville is a city in the Greater Boston Area (GBA) with a population of around 80,000. Due to its location, it has long been a popular residential area for students attending MIT, Tufts, and Harvard among other educational institutions. This popularity has driven up real estate values and populations, thus prompting the city government to come up with a masterplan titled ‘Somervision’ to tackle existing and anticipated changes. (Acitelli 2012)
The core concerns outlined in the SomerVision masterplan document are: (Mayor’s Office 2012)
- Increased Employment
- Increase in accessible public space
- New Affordable Housing
- Higher and penetrative NMT and Public Transport Options
- Higher growth in newer areas, and preserving traditional areas
From the point of our hypothesis, it would make more sense to consider point 4 - Higher and penetrative NMT and Public Transport Options. The Boston metropolitan area has a public transportation service provided by the MBTA (or the Massachusetts Bay Transportation Authority). Although the service is considerably robust, especially considering the car-dependent nature of most American cities, there are still some issues with last-mile connectivity – especially in the fringe areas.
Methods
Datasets
I used information from three different datasets:
a. Building Permits Dataset: This was the base dataset we worked with. It contained information on 26,222 entries through 28 variables, key among which for my analysis were:
- Permit Type,
- Address,
- Total Permit Fees,
- Date applied and date Approved
b. Tax Assessor’s Dataset: This dataset was used to get information on not just the land parcels which applied for a permit, but also for those which did not. It contained information on 33,490 entries through 37 variables, key among which for my analysis were:
- Total Value of Parcel
- Site Address
- Zoning
These two datasets were joined using a variable called LOC_ID which was a unique ID for every parcel.
c. MBTA Bus Dataset: The MBA bus dataset was derived from the shapefile received from MassGIS – a repository of shapefiles related to Massachusetts. This contained data on all Bus stops across the MBTA network of eastern Massachusetts. I subset it to get only those stops which are in Somerville and within a buffer of 1 kilometer from its borders.
Nearest Bus Stop Variable
The main variable on which the study is based is the nearest bus stop variable. By combining the tax assessor’s data with the building permits data, we got the master list of land-parcels. The pointDistance() function from the RASTER package in R was used:
- To find the distance between all land parcels and all bus stops
- Then the
apply()function was used to find the minimum distance for each land parcel and bus stops - This process was repeated to get a list of bus stops unique to each parcel which were the closest to it.
Thus, we get our main variable on which a large part of this study is based.
Results
Distance Analysis
The primary variable we constructed (The distance to the nearest bus stop) resulted in the following map:
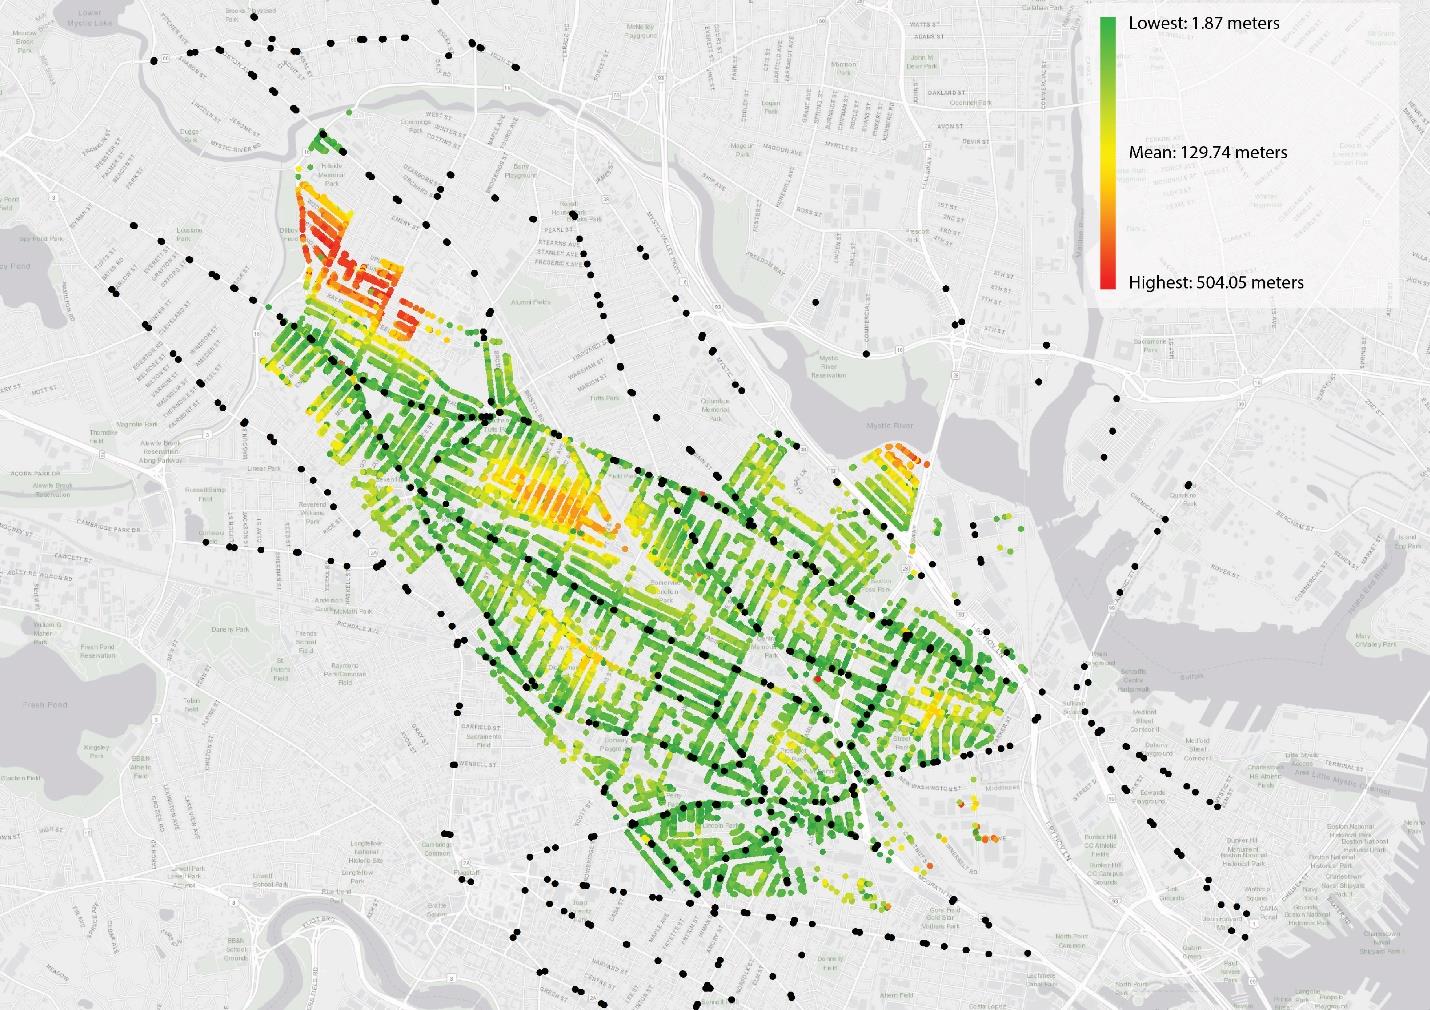
This map reveals a few things. The vast majority of bus stops (in black) are along east-west corridors. As such, we do not observe any north-south routes except for two near Union Square. Also visible are two areas where a large number of parcels are further away (more than 400m away) from their closest bus stand. Although it is tempting to confirm that these are the areas requiring immediate attention, one must note that this distance analysis has one drawback:
It is the distance as-the-crow-flies and does not take into account the actual path – which in the case of cities in the Boston area may not always be cardinal and straight. A few more factors to consider when looking at accessibility, which is a limiting feature in this study are road gradients, user profile (age/disability), climate/weather conditions, lighting conditions at night, footpath availability and quality etc.. This by no means is an exhaustive list, and differences due to local conditions can change.
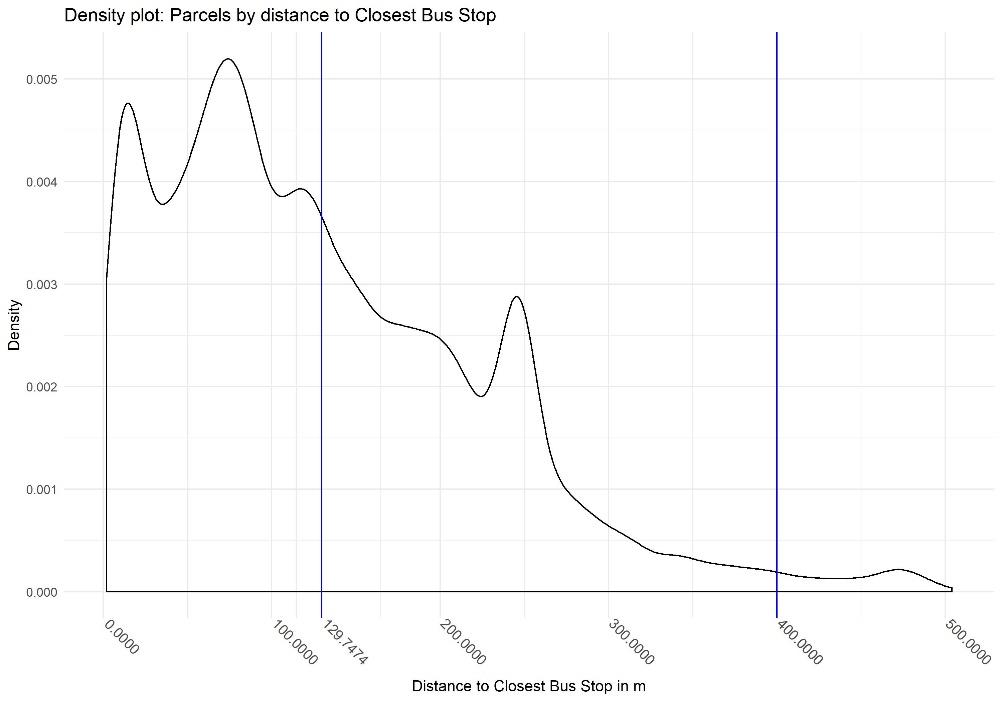
As seen from the map, even though there are some outliers, the vast majority of parcels in Somerville are well within the 400m ideal maximum. This maximum considers the average distance a person can walk in 7 minutes. (El-Geneidy, et al. 2014)
Distribution Across Somerville
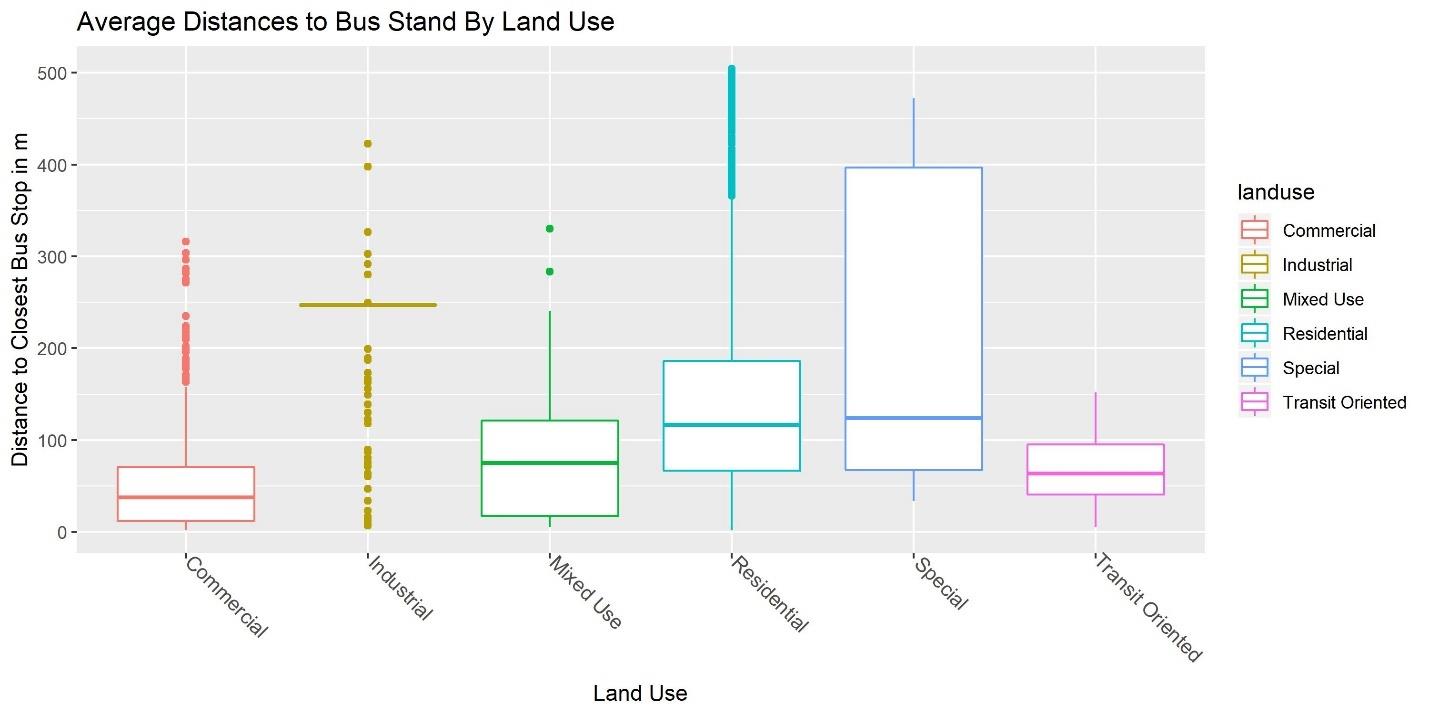
This distribution manifests itself in a varied fashion when applied to different areas of Somerville, and also across land use.
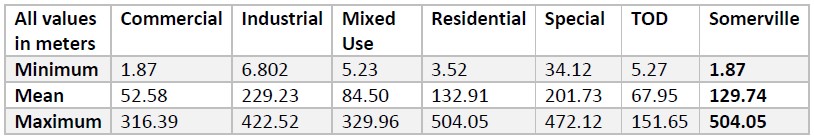
Land Use:
We see a definite divide between land parcels with commercial activity (commercial, mixed-use, TOD) and those without (residential, special – meaning Tufts University and parkland, and industrial areas)
This goes with the idea of having commercial activity near transit nodes. The question here is what influences what, if at all?
Census Tract:
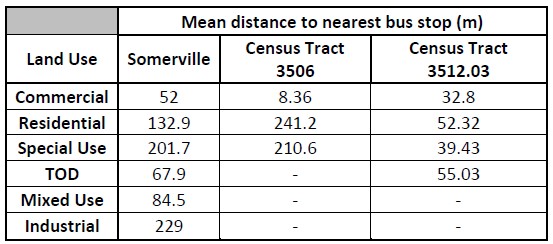
When we compare the distances by census tract, it is quite evident that there are many census tracts which deviate from the city-wide mean. The two most notable being Census tract 3506 and Census Tract 3512.03:
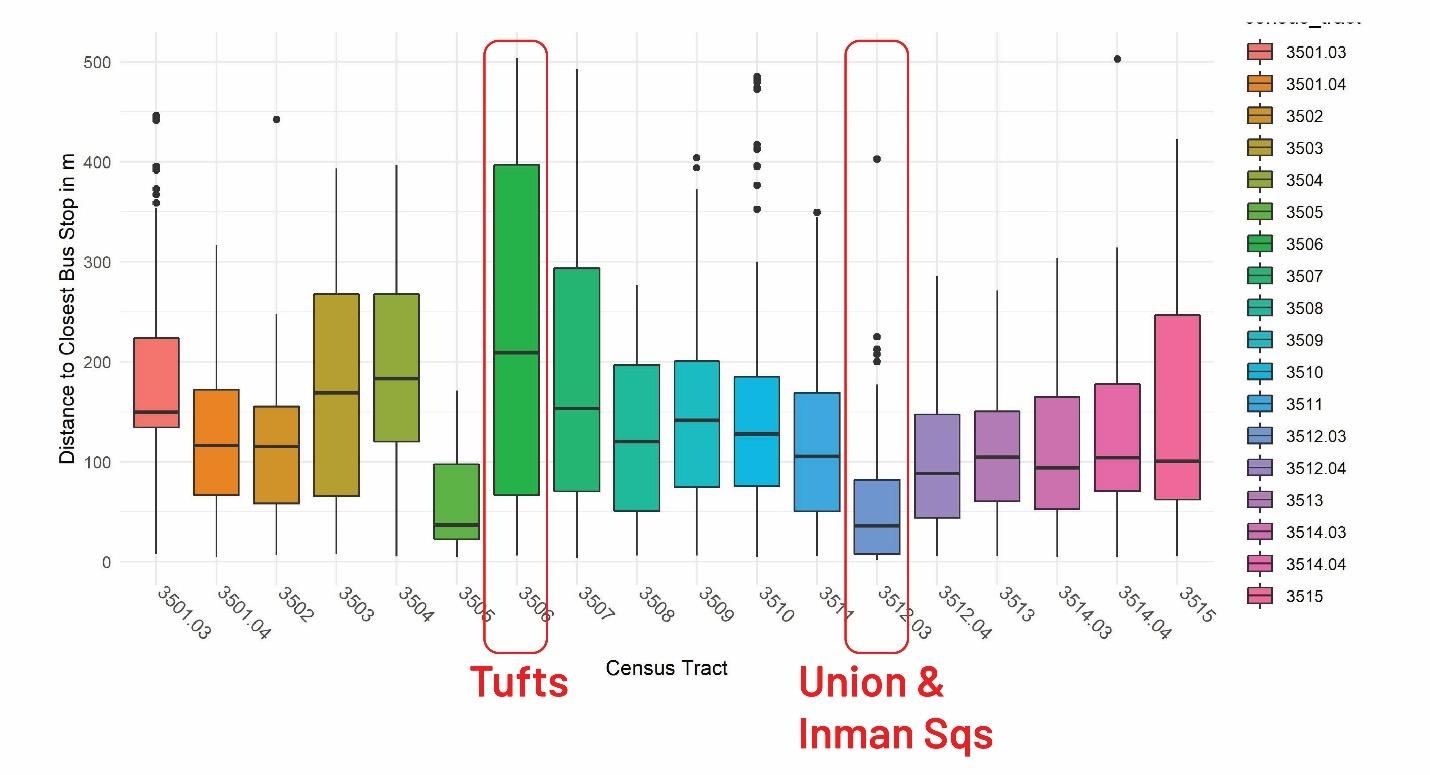
When comparing these two census tracts with Somerville as a whole and divided by Census Tract, we see a very large variation. This analysis also shows the importance of the geographic unit of analysis. Here I feel the census tract fits perfectly because:
a. Number of units: 18 census tracts in Somerville makes it easier to compare b. Size: averaging around 4000 people each, there is enough variation within them to offset most extremes c. Similarity: Census tracts are generally drawn with similar characteristics, thus making comparisons between them easier to analyze.
Addressing our Hypothesis
Developing on the relationship between public transport availability and land use, and based on the knowledge of the Boston metropolitan area being a high desirability area, we can therefore relook at our hypothesis:
Does distance to or availability of public transport have any effect on investment and property prices in a city?
To carry out this study, I considered the following three variables:
a. Minimum Distance to Stop:
This is the distance to the closest bus stop for any given parcel This addresses the first component of our research question: distance to or availability of public transport
b. Total Permit Fees:
This is the value of the permit application fee for each permit aggregated by parcel ID so we get the total value of all permit applications for each land parcel This addresses the second part of our research question: Investment
c. Total Value:
This variable is the total amount of the land and building values for any given parcel of land. This addresses the third component of our research question: Property prices
Regressions:
To find if there is any correlation, and if any, what the effect might be on each other, we carried out two regressions:
a. On permit fees b. On land value
In R:
We used the lm() function to carry out the bivariate regressions, and then used the summary() function to get the results.
Results
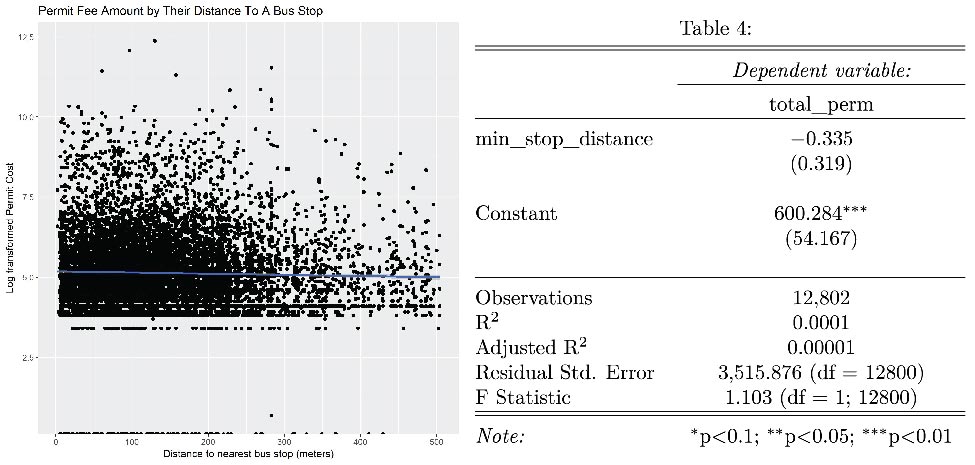
Investment
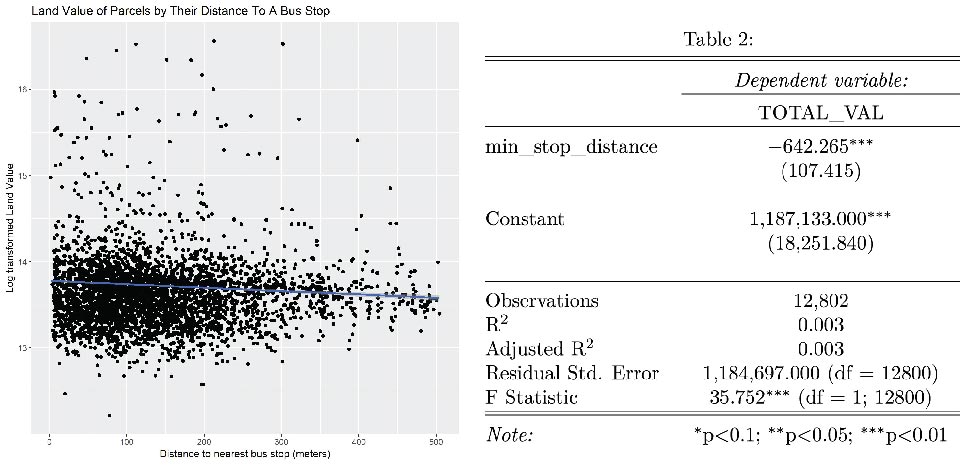
Land Value
Interpretation:
Both regressions show weak and negative influences of distance to bus stop on the dependent variables. Investment value increased by around 33 cents for every meter the property was closer to a bus stop. Similarly, for land value, we see that there is an increase of around 642 dollars (in total land value, not per unit area) for every meter the property is closer to a bus stop.

However, it may be recalled that properties with a commercial component (Commercial/TOD/Mixed Use) tend to be closer to a bus stop. The regression results above also show that property values are higher if a property is commercial as opposed to a residential property, and as such we cannot rule out these influences either.
Discussion
Although our analysis shows very weak relationships between access to transit and investment & land value, there are other studies which have looked at this same phenomenon. One notable study is from the Dukakis Center for Urban and Regional Policy titled ‘Maintaining Diversity in America’s Transit-Rich Neighborhoods: Tools for Equitable Neighborhood Change’ by Pollock, Stephanie et al. (Pollock, Bluestone and Billingham 2010) talks about the importance of cultural (ethnic/racial) diversity of a neighborhood and how it is affected by desirability to live near transit. It looks at demographic groups – most notably historically repressed racial minorities who have been displaced due to high rentals and living costs arising out of the desire of wealthier aspirants wishing to live in transit rich areas – which were the areas occupied by the former people group for most of the twentieth century.
The extent of this study is not to provide a solution for the housing crisis or gentrification as a whole: There may be a need for institutional and cultural changes on how we view home ownership as an investment. (Hertz 2016)
This study aims to provide the city of Somerville with:
a. A broad understanding of their current state of public transportation; b. What and where the scope is for improvement and investments in infrastructure; c. How land use zoning could follow the aspirations of citizens evident in the pattern of permit applications as seen in this study.
References
Acitelli, Tom. 2012. “SomerVision Sees 6,000 New Homes, Lots of Green Line Riders.” Curbed. Curbed. May 30. https://boston.curbed.com/2012/5/30/10367004/there-are-many-juicy-morsels.
El-Geneidy, A, M Grimsrud, R Wasfi, P Tétreault, and J & Surprenant-Legault. 2014. New evidence on walking distances to transit stops: Identifying redundancies. Transportation.
Hertz, Daniel. 2016. “Housing can’t be a good investment and affordable.” City Observatory. July 20. http://cityobservatory.org/housing-cant-be-a-good-investment-and-affordable/.
Kumar, Ashok, and Karla Gonzales Karvajal. 2017. “Providing road access to all: how India is turning a distant dream into reality.” World Bank. January 8. http://blogs.worldbank.org/endpovertyinsouthasia/providing-road-access-all-how-india-turning-distant-dream-reality.
Mayor’s Office, Somerville. 2012. “SomerVision.” Somerville: Somerville City Government. https://www.somervillema.gov/sites/default/files/somervision-comprehensive-plan.pdf.
Pollock, Stephanie, Barry Bluestone, and Chase Billingham. 2010. Maintaining Diversity in America’s Transit-Rich Neighborhoods: Tools for Equitable Neighborhood Change. Boston: Dukakis Center for Urban and Regional Policy, Northeastern University.
Schaper, David. 2018. “‘Talent Wants Transit’: Companies Near Transportation Gaining The Upper Hand.” National Public Radio. November 29. https://www.npr.org/2018/11/29/671203167/talent-wants-transit-companies-near-transportation-gaining-the-upper-hand?fbclid=IwAR2hac65WWiaBF95s6yyY3bzDoG-lKo5lhWlww5_k4gqyNRWXCAvC3cHyF4.
Syed, Samina, Ben Gerber, and Lisa Sharp. 2014. “Traveling Towards Disease: Transportation Barriers to Health Care Access.” J Community Health, Dec 13.
Aseem Deodhar
Transportation Planner
My research interests include transit user behaviour, spatial movement pattern analysis, and transportation infrastructure.