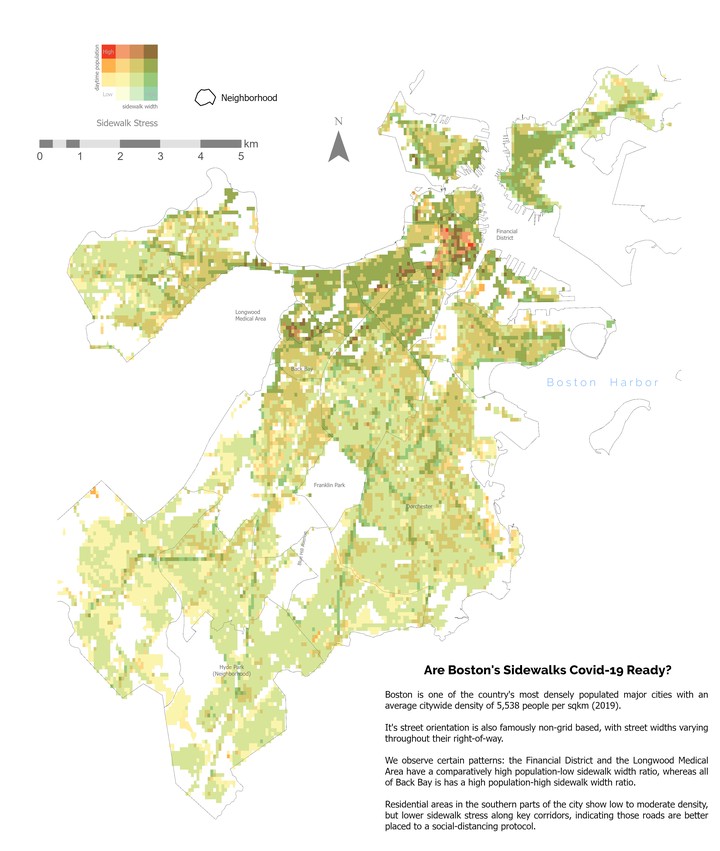
 A bivariate choropleth map for the Sidewalk Stress Index
Boston Sidewalks
Profiling the sidewalks of Boston from a social distancing point of view.
Sidewalk Stress Index
To develop the sidewalk stress index, we considered two criteria:
Population Density: Obtained from the LandScan datasource. Provides day and night incident population for a given area. It is a raster dataset with a pixel of approximately 90m by 90m size.
Sidewalk Width: Obtained from the Analyze Boston which is the City of Boston’s open data hub. It includes data on sidewalk segments in the City of Boston. The main variable we are interested in is the Sidewalk Width, which is in feet.
By converting the raster population data into polygons, the mean sidewalk width incident on the cell was calculated with a spatial join.
library(sf)
library(dplyr)

# Normalizing data to export as a shp file

ls_day_boston <- read_sf("landscan_r_analysis/boston_day_stress/boston_day_stress.shp")
ls_ngt_boston <- read_sf("landscan_r_analysis/boston_night_stress/boston_night_stress.shp")

# Calculating percentile rank to get normalized data:

# daytime population:
ls_day_boston$nrm_pop_dy <- percent_rank(ls_day_boston$gridcode)
ls_day_boston$nrm_swk_dy <- percent_rank(ls_day_boston$SWK_WIDTH)
ls_day_boston$stress_dy <- ls_day_boston$nrm_pop_dy-ls_day_boston$nrm_swk_dy

#nighttime population
ls_ngt_boston$nrm_pop_nt <- percent_rank(ls_ngt_boston$gridcode)
ls_ngt_boston$nrm_swk_nt <- percent_rank(ls_ngt_boston$SWK_WIDTH)
ls_ngt_boston$stress_nt <- ls_ngt_boston$nrm_pop_nt-ls_ngt_boston$nrm_swk_nt

# saving shapefiles
st_write(ls_day_boston, "landscan_r_analysis/boston_day_stress/boston_day_stress.shp", delete_layer = TRUE)
st_write(ls_ngt_boston, "landscan_r_analysis/boston_night_stress/boston_night_stress.shp", delete_layer = TRUE)
Both values were normalized by percentile ranking between 0 & 1. By subtracting each cell’s normalized population, with its corresponding normalized mean sidewalk width, we could compare (city-wide) how high or low the ratio was compared to the city-wide average. A negative score indicates lower than average stress, and a positive score indicates higher than average stress. Thus, we can consider four situational extremes:
Positive Score: 0.01 to +1
Low Density & High Sidewalk width
High Density & Low Sidewalk width
Negative Score: -1 to -0.01
Low Density & Low Sidewalk width
High Density & High Sidewalk width
Neutral Score:
- The fifth situation, would be a score of 0, indicating said location has a stress score comparable to the city-wide average.
Sidewalks – Are they good enough?
Social distancing norms in the wake of the Covid-19 outbreak suggest keeping a distance of at least 6 feet from another person when outdoors.
Can we say something about where physical distancing by looking at Boston’s sidewalks? Can we estimate which areas are more likely to conform to distancing guidelines based on combining sidewalk and other data?
To ensure that residents are able to comply with social distancing guidelines Many cities have restricted vehicular traffic on certain streets, or extended ‘sidewalks’ by taking in lanes by adding flex posts or traffic cones.
This idea is being developed in collaboration with Varun Adibhatla.
Data 1. Polyline and polygon shapefiles of sidewalks for the city of Boston. These can be used to identify sections of sidewalks and streets which do not adequately serve width regulations.
- LandScan data - Widely considered the “gold standard of population and mapping data in the United States, (this dataset) captures daytime and nighttime activity of the U.S. population at a resolution of roughly 90 meters or about 300 feet.”
Analysis
- Profile Boston Sidewalks for completeness and quality
- Join with Landscan data
- Identify areas with high/low sidewalk<>human activity
- Build a relationship map
- Identify areas that are likely to be infection hotspots (high population activity, low sidewalk widths)
15-minute Boston
Paris, under their mayor Anne Hidalgo is working to completely transform how people move around their city by introducing the ’15-minute’ city, where all aspects of a person’s life are achievable within a 15-minute walk, bike, or transit ride from their residence.
A project of this scale and magnitude will be required to be staged and completed in phases. If we consider the city of Boston, Massachusetts, how can we adapt this ’15-minute’ city plan here, taking into account its unique strengths, weaknesses, opportunities, and challenges?
Understandably, Boston’s current configuration does not allow for such a situation. Furthermore, a 15 minute walk is significantly shorter than a 15 minute bike ride, and generally speaking public transit will take you further than a bike in 15 minutes.
In what ways would Boston’s land-use configuration have to change, to accomodate these requirements? Does it really make sense to concentrate all businesses in one centralized ‘downtown’ area or Financial District?
Analysis
- Can we use POI data to evaluate the accessibility of various 15-minute regions based on population and car ownership?
- Can we create accessibility maps that allow Paris and other cities identify which areas require more amenities to make it eligible under a 15-minute accessible region?
15 Minute Walk Zones
By generating hexagonal tesselations of side equal to 1 mile (the generally accepted distance an average person can walk in 15 minutes) we divide the City of Boston into zones equalling a 1 mile radius. Since the radius of 1 mile is equal to the side of the hexagon, the circumscribed radius is also equal to 1 mile. This effectively creates (for each 1-mile hexagon) up to 6 overlapping zones with neighboring hexagons.
| 1 mile radius hexagons | 1 mile radius overlapping circles |
|---|---|
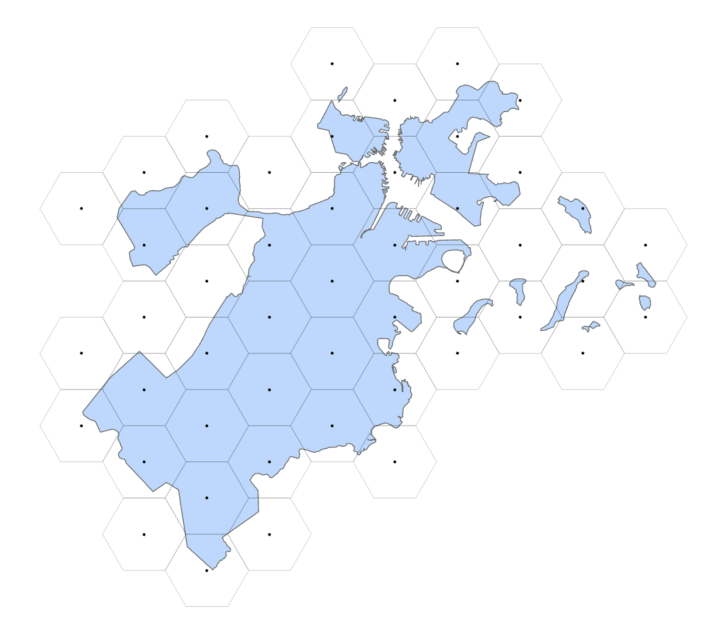 |
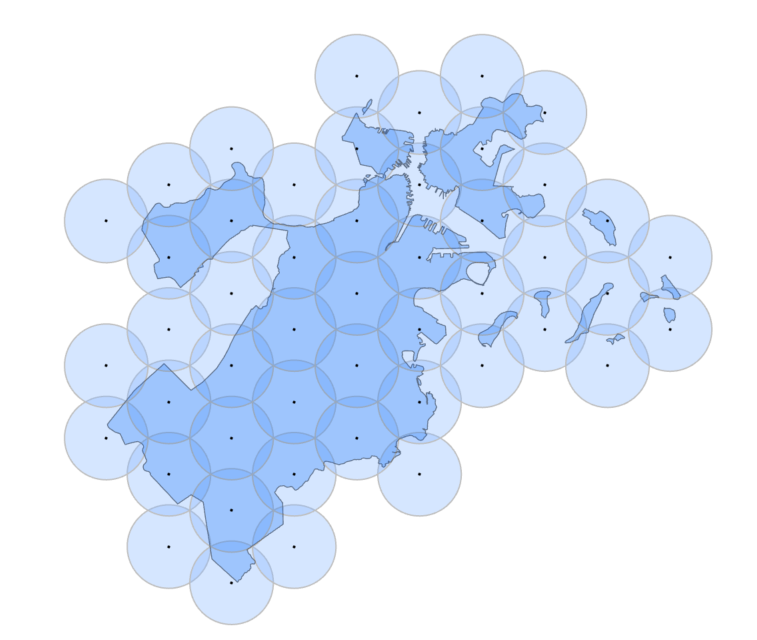 |
Working with the existing urban layout and physical infrastructure, how do we ensure that all the above mentioned services can be made available within this 1-mile zone? We mapped these two layers together: by getting the proportion of land covered under each major use type, how does each zone compare to the city-wide average?
bos_zones_ratio <- bos_zones %>%
                    select(SUBDISTRIC, area_sqm) %>%
                    group_by(SUBDISTRIC) %>%
                    summarise(area_sqm = sum(area_sqm))

bos_zones_ratio$landuseratio <- (bos_zones_ratio$area_sqm/sum(bos_zones_ratio$area_sqm))*100

bos_15minzones_ratio <- bos_15minzones %>%
  select(TARGET_FID, SUBDISTRIC, area_sqm) %>%
  group_by(TARGET_FID, SUBDISTRIC) %>%
  summarise(area_sqm = sum(area_sqm)) %>%
mutate(landuseratio = (area_sqm/sum(area_sqm))*100)| Land Use for Boston City | Land use proportions |
|---|---|
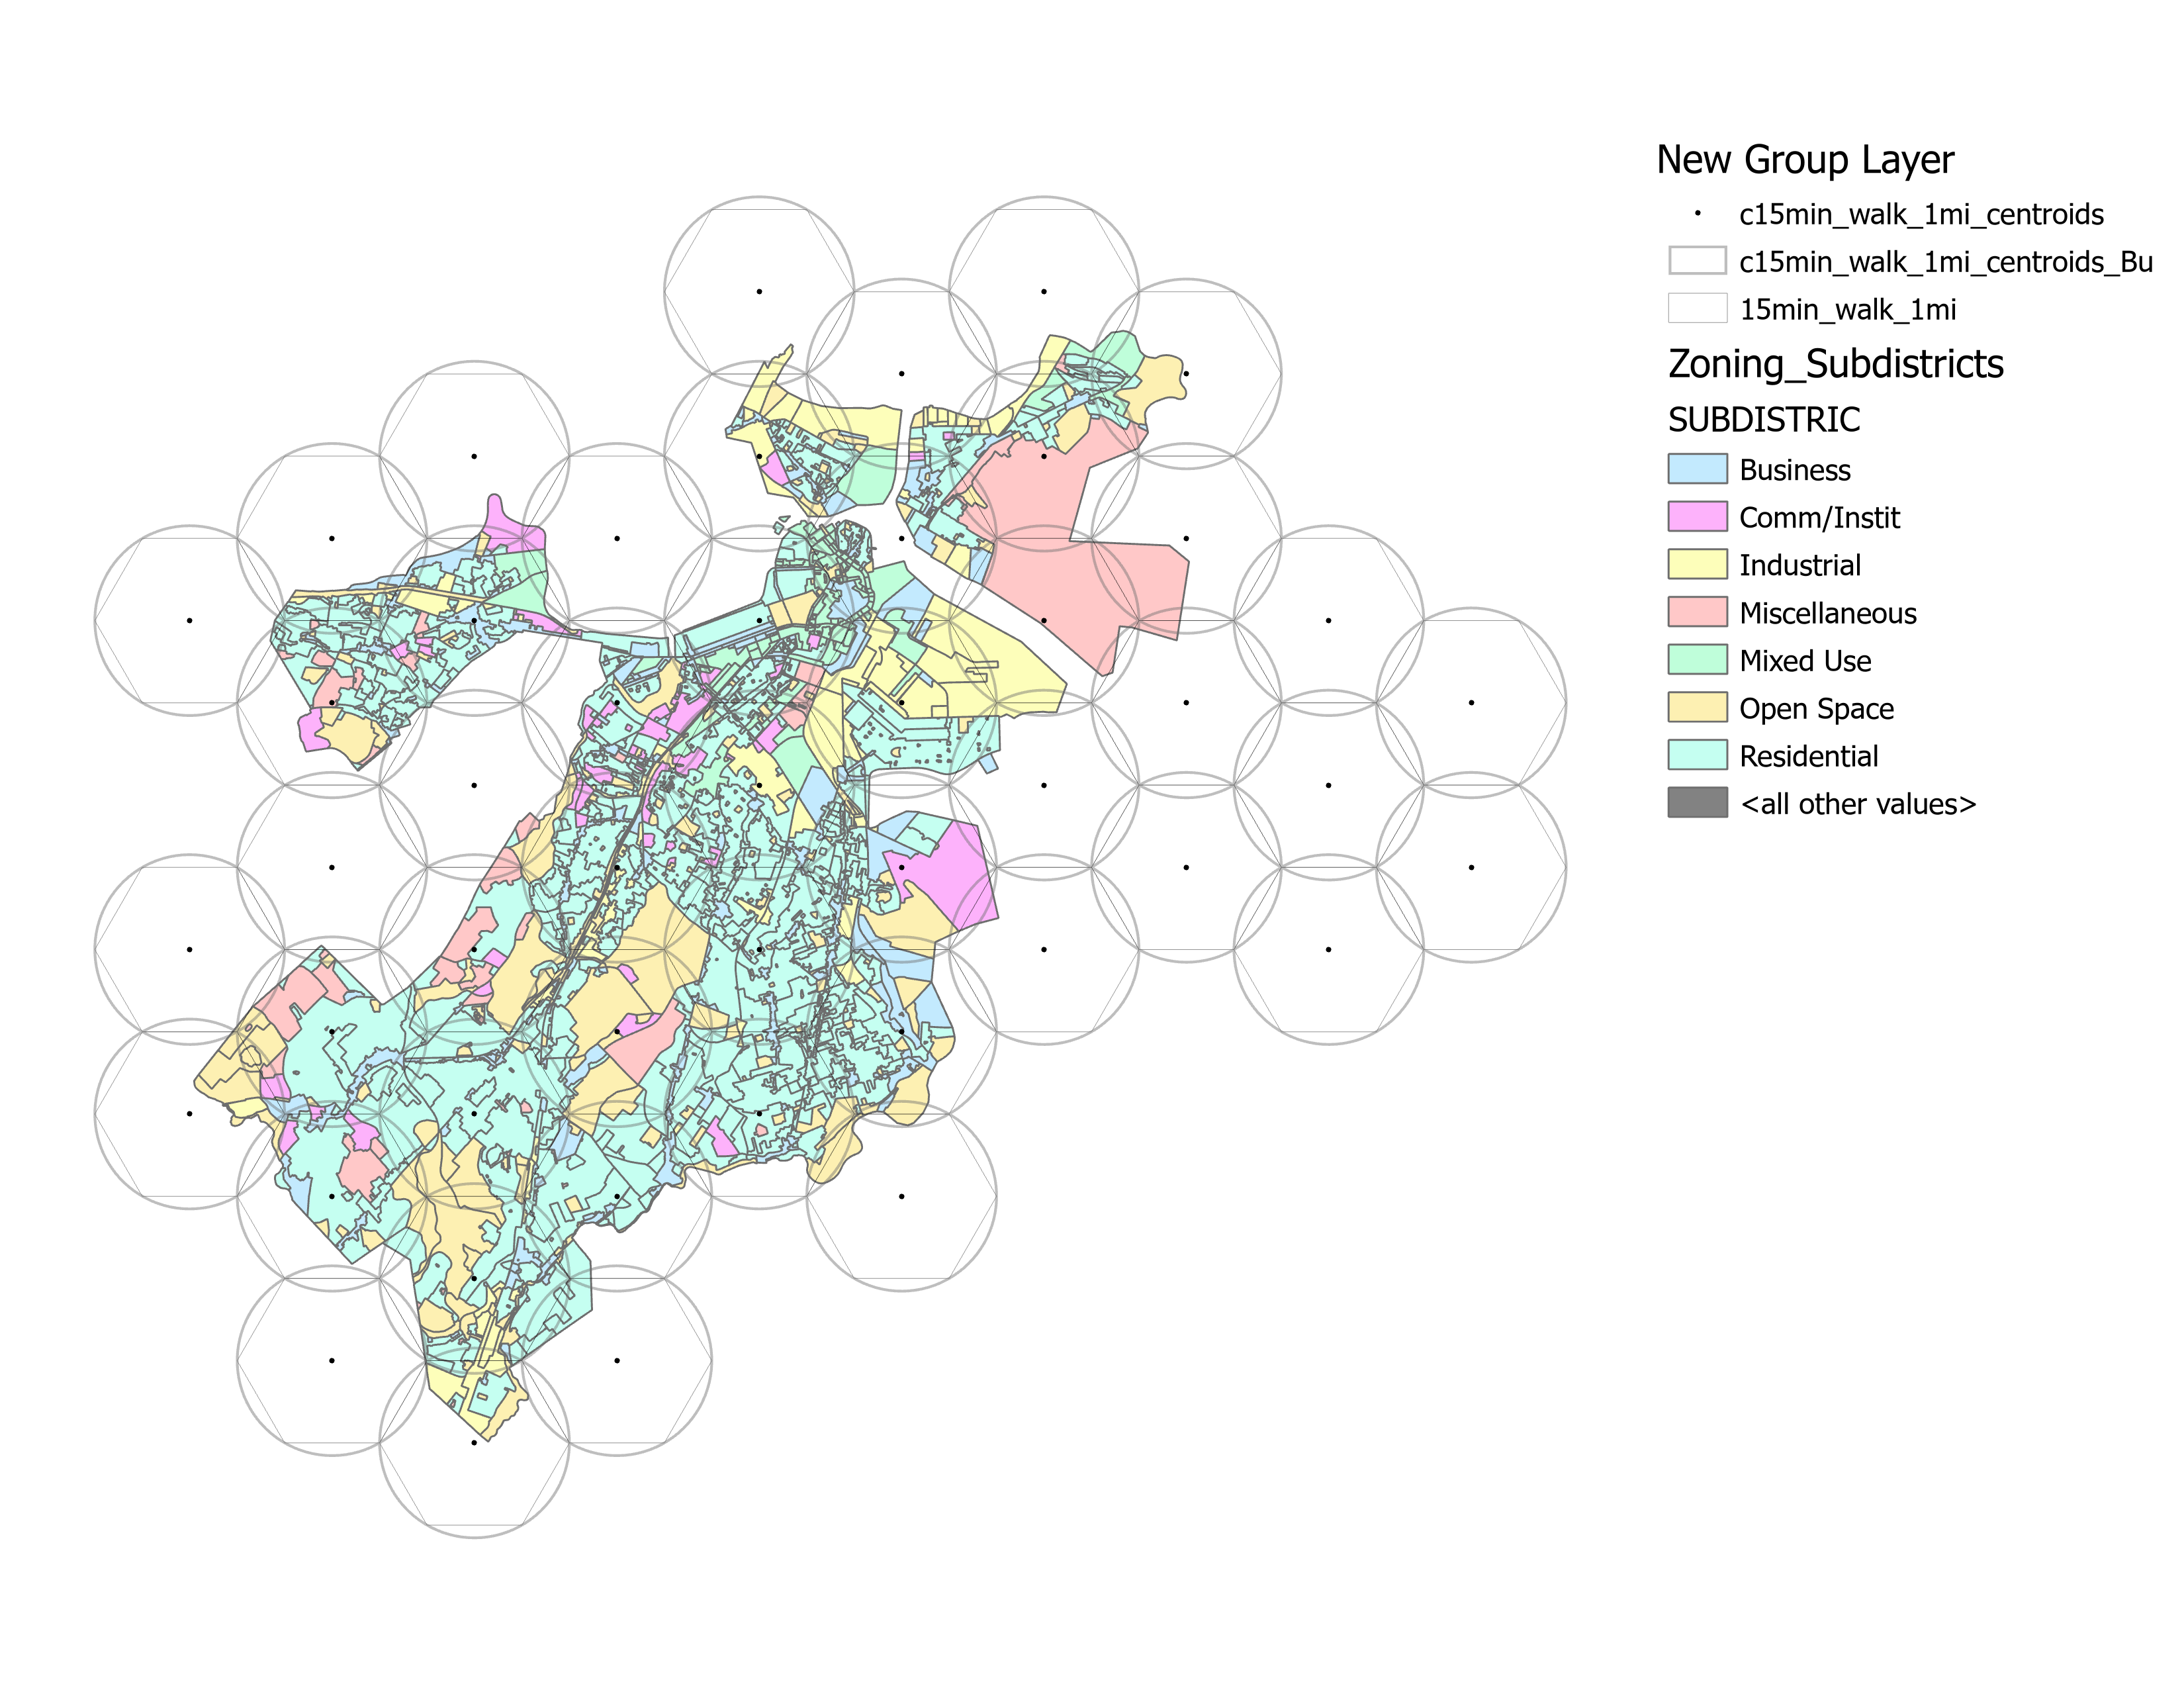 |
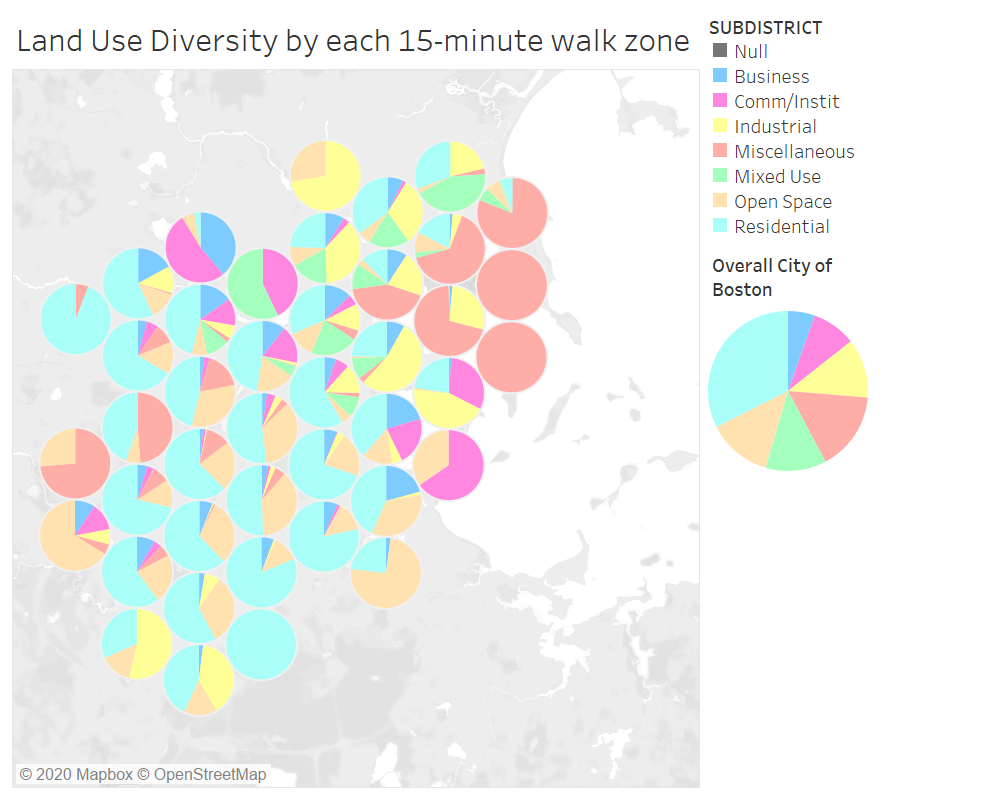 see data on Tableau Public see data on Tableau Public |
What policy, design and planning changes can be made to transform each zone into a self-sustaining 15-minute walk zone?
Narrative * Who and where will interventions make the most difference? * How can we avoid falling into the systematic bias created by 20 th century urban planning? * How can we create a general purpose analysis to evaluate 15-minute accessibility for any city?
Potential Interventions
As we identified in our map, there are 4 key typologies we observe with regard to the Sidewalk Stress Index. These areas have different urban-level characteristics apart from just the Sidewalk Stress Index: their land-use typologies may vary, as can through vehicle volume, availability of public transit and alternative mobility needs, as well as parking requirements. All these factors affect the urban morphology of the neighborhood. Thus we identify a few areas in Boston which correspond to these typologies, and work out urban design interventions aimed at handling incident sidewalk stress:
| Density | Sidewalk Width | Example Locality | Current View | Proposed View |
|---|---|---|---|---|
| High | High | Copley Square |  |
 |
| Low | Low | Field’s Corner |  |
 |
| Low | High | Franklin Park |  |
 |
| High | Low | Financial District/Old State House |  |
 |
Aseem Deodhar
Transportation Planner
My research interests include transit user behaviour, spatial movement pattern analysis, and transportation infrastructure.