 Mapping in R
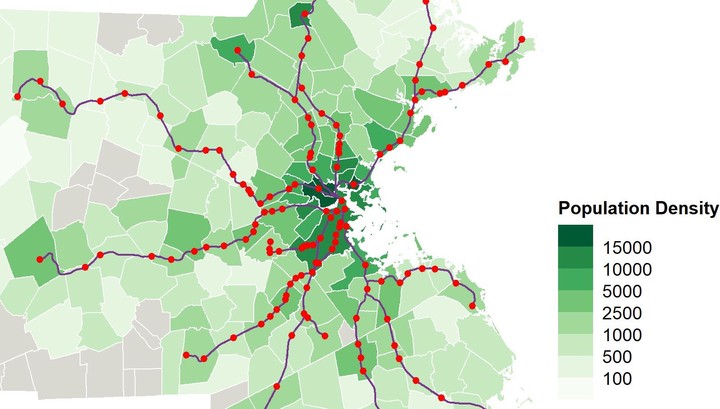
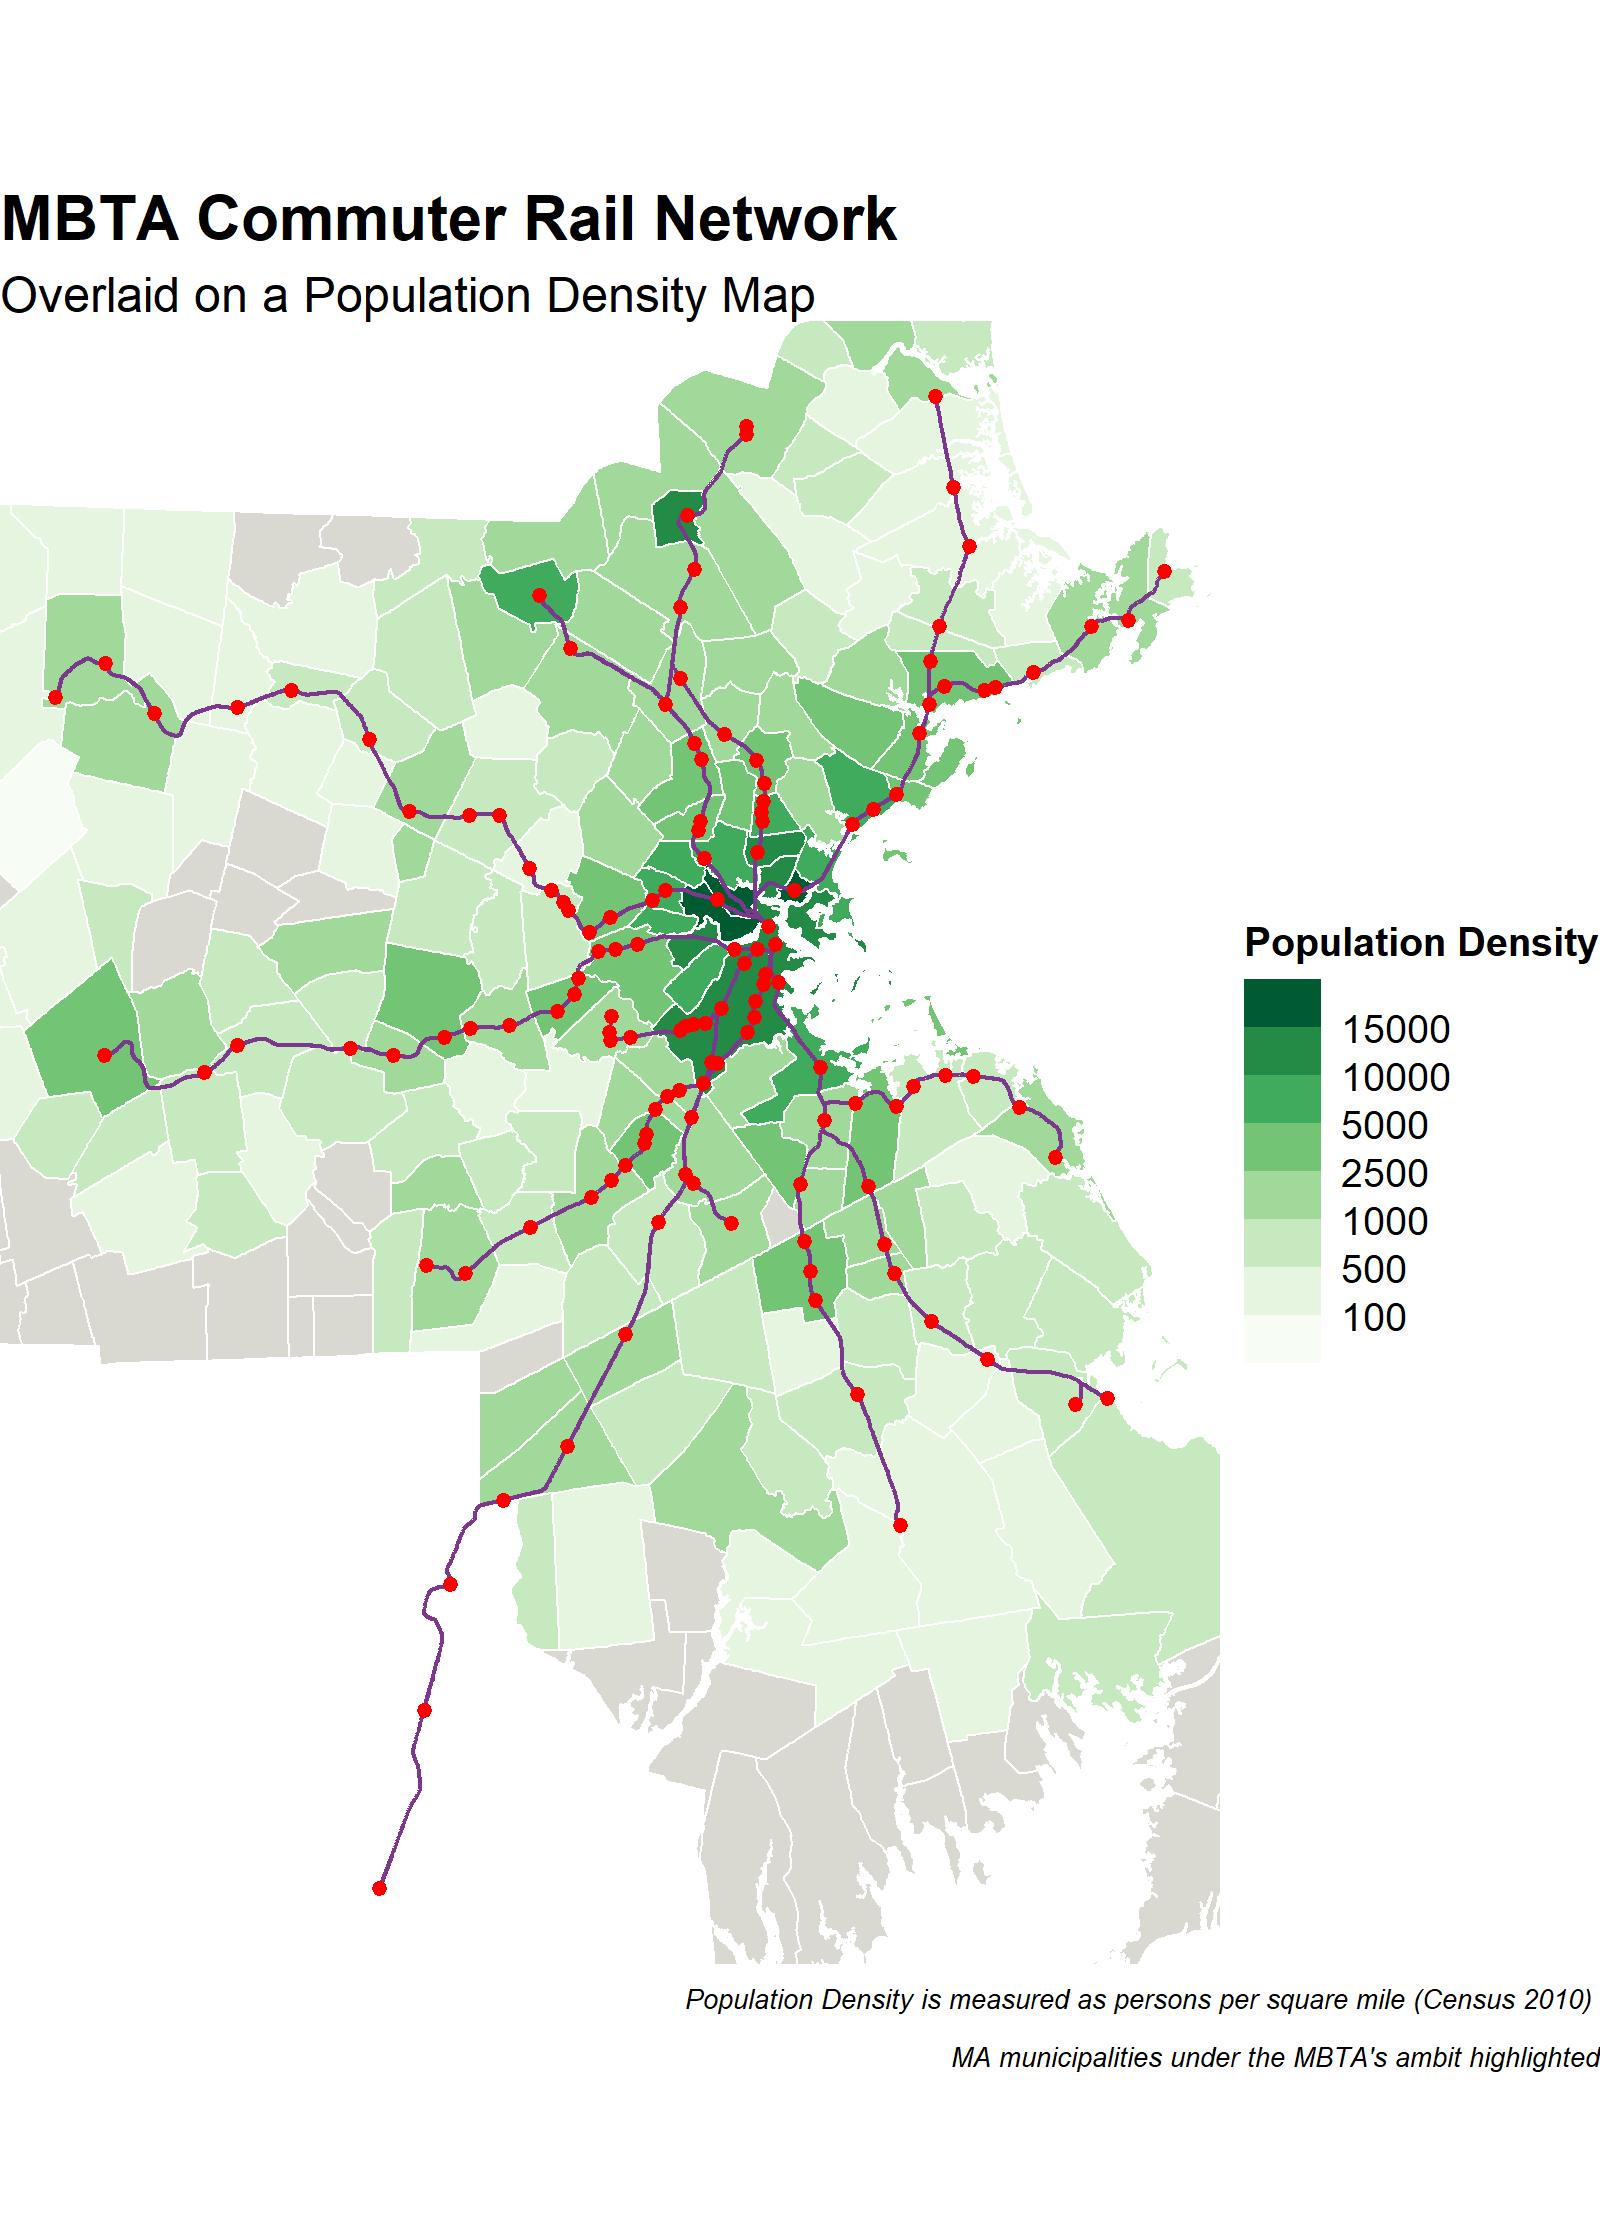
Spatial Analysis and Mapping in R using the {sf} and {ggplot2} packages
On March 17th of 2021, I had the opportunity to introduce the concepts of spatial analysis and mapping in R to the Big Data for Cities class at Northeastern University - the same class where I had initially learned all of this in the Fall of 2018.
I gave a brief overview of the basic components of a spatial data file, and how to use the {sf} and {ggplot2} packages to map the contents of a spatial data file, as well as some popularly used functions to manipulate spatial objects.
In addition to the technical introduction, I spoke about the various kinds of administrative geographies in the United States - political and census geographies.
Code and Files
You can download the code and data files used to plot the map above from this link and try to map, and manipulate it. I’d love to see what maps you make!
Aseem Deodhar
Transportation Planner
My research interests include transit user behaviour, spatial movement pattern analysis, and transportation infrastructure.